Industry Intelligence
Great Britain Road Traffic and Roadside Breakdown Trends | 2026 Industry Overview
An evidence-led overview of 2025 road traffic volumes, commonly reported breakdown causes and the operational factors influencing roadside assistance across Great Britain.
Location: Great Britain
Overview
Great Britain’s road network supports hundreds of billions of vehicle miles each year.
Private motorists, commercial fleets, freight operators and public transport services rely on this network to move people, goods and services between cities, regions and rural communities.
Most journeys are completed without disruption. However, vehicle breakdowns remain a regular feature of road travel, ranging from relatively routine battery and tyre failures to more complex mechanical and electrical faults.
This report examines:
The scale and composition of road traffic in Great Britain.
The strategic routes carrying the highest traffic volumes.
Frequently reported vehicle breakdown causes.
Differences between passenger-car, van and heavy-goods-vehicle incidents.
The operational factors influencing roadside response and recovery.
Road Traffic in Great Britain
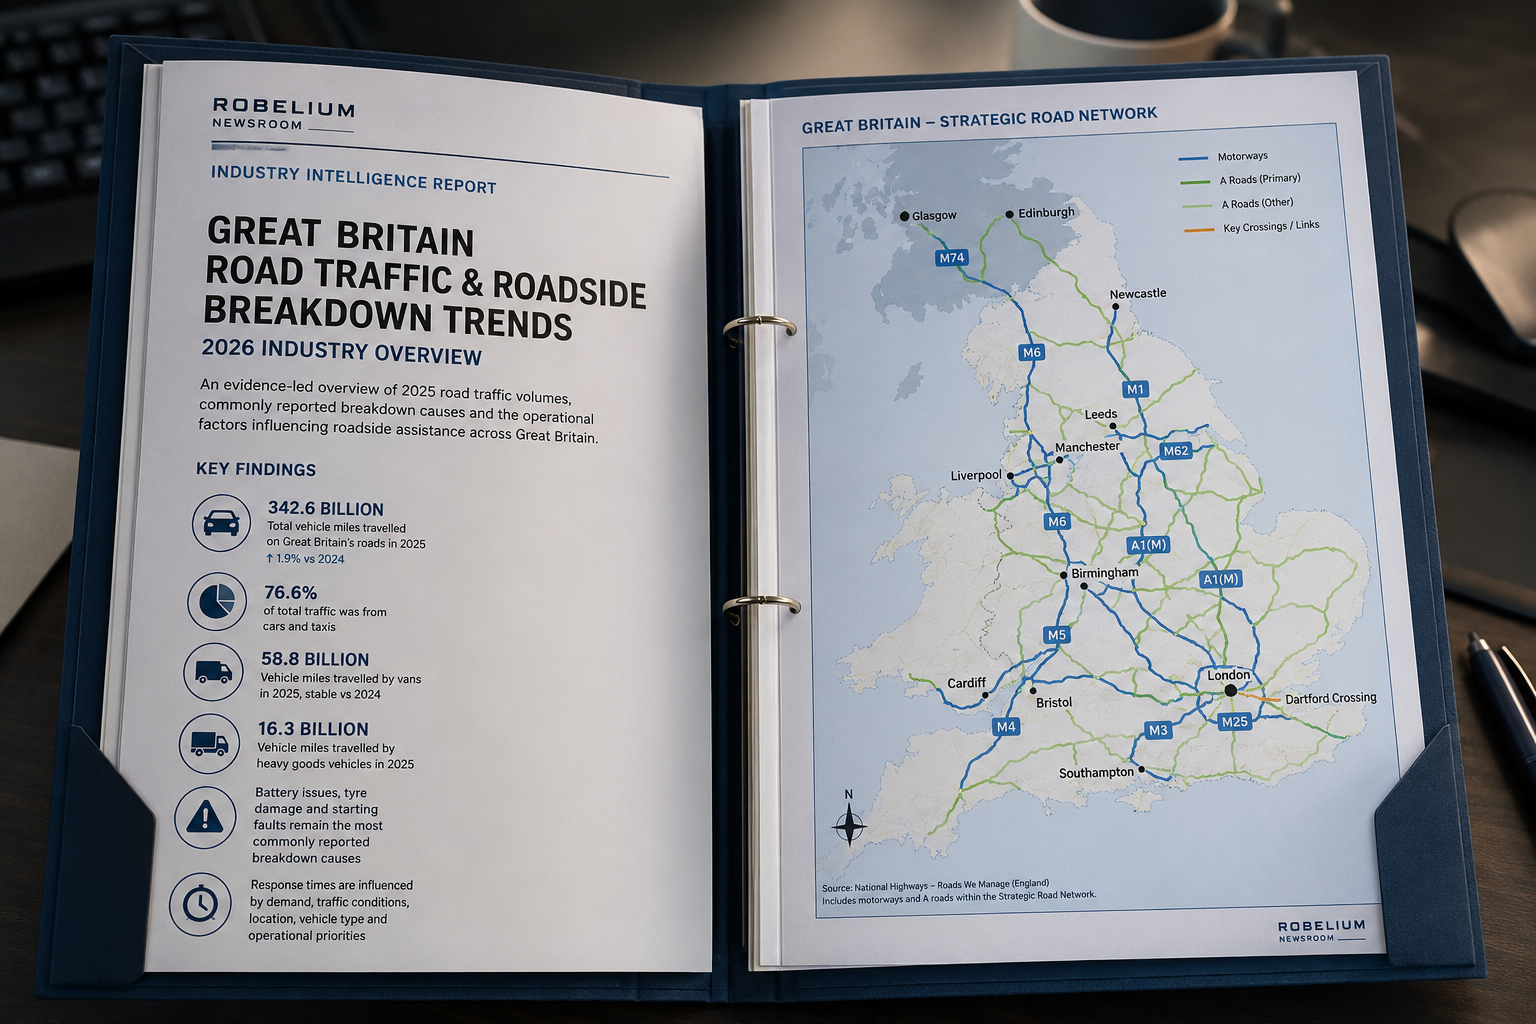
Department for Transport estimates indicate that motor vehicles travelled approximately 342.6 billion miles on Great Britain’s roads during 2025.
Cars and taxis continued to account for the majority of traffic, followed by vans and heavy goods vehicles.
Vehicle Traffic by Category
Vehicle category | Estimated traffic during 2025 |
|---|---|
Cars and taxis | 262.4 billion vehicle miles |
Vans | 58.8 billion vehicle miles |
Heavy goods vehicles | 16.3 billion vehicle miles |
Motorcycles | 3.0 billion vehicle miles |
Buses and coaches | 2.0 billion vehicle miles |
Cars and taxis represented more than three-quarters of total road traffic.
Van traffic remained broadly stable during 2025 but remained above its 2019 pre-pandemic level.
Heavy goods vehicles accounted for a smaller proportion of total mileage. Their operational importance remains substantial because of their role in freight movement and the specialist response often required when a larger vehicle becomes immobilised.
Key fact: Cars and taxis accounted for approximately 76.6% of estimated motor-vehicle traffic in Great Britain during 2025.
England’s Strategic Road Network
National Highways manages England’s Strategic Road Network, comprising motorways and major A-roads.
Although this network represents only a small proportion of the country’s total road mileage, it carries approximately:
One-third of traffic.
Two-thirds of freight.
Its strategic importance means that even a single stopped vehicle can have wider consequences.
The impact is often greater where an incident occurs:
In a live traffic lane.
Close to a major junction.
Inside or near a tunnel.
On a bridge or river crossing.
Within a restricted section of carriageway.
During a peak travel period.
A breakdown on a local road may affect one vehicle and a limited section of traffic.
The same mechanical fault on a motorway or strategic route may contribute to lane restrictions, queue formation, secondary incidents and additional safety risks.
High-Volume Strategic Corridors
Some of Great Britain’s busiest road corridors carry consistently high volumes of private, commercial and freight traffic.
Examples include:
M25 London Orbital
M1 between London and the Midlands
M6 through the West Midlands and North West
M4 between London, the Thames Valley and South Wales
M62 across Northern England
M5 through the West Midlands and South West
A1 and A1(M)
A282 Dartford Crossing
Birmingham motorway network
Greater Manchester motorway approaches
These routes should not automatically be described as having the highest breakdown rate.
Publicly available traffic data confirms that they carry substantial vehicle volumes. It does not prove that an individual vehicle is more likely to fail on those roads.
Higher traffic exposure can, however, increase the absolute number of roadside incidents and amplify the consequences when a vehicle becomes stranded.
Frequently Reported Breakdown Causes
Published roadside-assistance guidance consistently identifies several recurring fault categories.
Frequently reported causes include:
Flat or faulty 12-volt battery.
Tyre puncture, wheel damage or loss of pressure.
Starting or charging-system fault.
Electrical or engine-management fault.
Cooling-system failure or overheating.
Fuel-related incident.
Mechanical component failure.
Reported categories and their frequency vary between providers, vehicle types, seasons and operating environments.
No single publicly available dataset provides a complete national breakdown profile covering every vehicle, incident and roadside-assistance operator across Great Britain.
Battery-Related Incidents
Battery faults remain among the most frequently reported causes of roadside assistance.
Common contributing factors include:
Battery age and deterioration.
Infrequent vehicle use.
Repeated short journeys.
Cold weather.
Parasitic electrical drain.
Charging-system faults.
Vehicles remaining stationary for extended periods.
Modern vehicles continue to rely heavily on their 12-volt electrical systems, including many hybrid and battery-electric vehicles.
A depleted or failed low-voltage battery can prevent a vehicle from starting or activating its main systems, even where the high-voltage traction battery remains charged.
Tyre and Wheel Incidents
Tyre-related incidents can result from:
Punctures.
Sidewall damage.
Road debris.
Pothole impact.
Wheel damage.
Incorrect tyre pressure.
Excessive wear.
The response required depends on the vehicle and the equipment available.
Some vehicles carry a conventional spare wheel. Others rely on temporary repair kits, compact spare wheels or mobility systems.
Where a tyre cannot be repaired safely, or where the vehicle has no usable replacement wheel, recovery may be required.
Electrical and Engine-Management Faults
Electrical and engine-management faults can be difficult to diagnose at the roadside.
A warning light may be associated with:
Starting or charging-system failure.
Sensor malfunction.
Wiring fault.
Engine-management problem.
Fuel-delivery issue.
Loss of communication between control units.
Restricted operating mode.
Some faults may allow the vehicle to continue operating at reduced performance.
Others may prevent restarting or require the vehicle to be transported for further diagnosis.
Differences Between Vehicle Categories
The operational impact of a breakdown depends partly on the type, size and use of the vehicle involved.
Passenger Cars
Passenger cars account for the largest share of road traffic and therefore represent a substantial proportion of roadside-assistance demand.
Frequently encountered incidents include:
Battery failure.
Punctures and tyre damage.
Starting faults.
Warning-light-related problems.
Cooling-system faults.
General mechanical failures.
The wider impact is often limited unless the vehicle is stranded in a live lane, restricted section or heavily congested location.
Vans and Light Commercial Vehicles
Vans may cover higher annual mileages and often operate under demanding commercial conditions.
A breakdown can affect:
Deliveries.
Service appointments.
Business schedules.
Perishable or time-sensitive loads.
Driver working hours.
Business continuity.
The vehicle may also be carrying tools, stock or equipment, which can complicate onward transport or vehicle replacement.
Heavy Goods Vehicles
Heavy goods vehicles represent a smaller proportion of total road traffic but can create more complex roadside incidents.
Their size and weight may require:
Specialist recovery vehicles.
Additional traffic management.
Load assessment.
Vehicle stabilisation.
Specialist towing equipment.
Coordination with police or traffic officers.
Longer clearance periods.
An immobilised HGV can have a disproportionate effect on road capacity, particularly where it blocks a live lane or restricted section of carriageway.
What Influences Roadside Response Times?
Roadside response time cannot be accurately estimated from distance alone.
A recovery vehicle may be geographically close to an incident but still face delays because of congestion, road restrictions or the need to deploy suitable equipment.
The main factors influencing response include:
Current incident demand
Multiple breakdowns occurring within the same area can reduce immediate vehicle availability.Traffic congestion
Recovery vehicles must travel through the same road network as other traffic.Time of day
Peak commuting periods can significantly increase journey times.Breakdown location
A motorway hard shoulder, live lane, city centre, rural road or private site will each require a different approach.Road access and restrictions
Width restrictions, low bridges, controlled zones and temporary closures may limit access.Vehicle type and condition
A passenger car, loaded van, electric vehicle or HGV may require different equipment.Specialist recovery requirements
Some incidents require lifting equipment, skates, heavy-recovery vehicles or specialist transport.Weather conditions
Heavy rain, snow, ice, strong winds or extreme heat can affect travel and working conditions.Safe-stopping arrangements
Assistance may be delayed until the scene can be accessed safely.Incident prioritisation
Drivers in exposed or dangerous locations may require priority over vehicles parked safely.Police or traffic-officer involvement
Some incidents require traffic control or formal clearance before recovery can begin.Roadworks, diversions and lane closures
Temporary traffic management can increase travel distance and restrict access.
Response time is therefore an operational outcome rather than a simple calculation based on mileage.
Urban, Motorway and Rural Conditions
Different environments create different recovery challenges.
Urban Areas
Urban incidents may be difficult to reach because of:
Congestion.
Restricted streets.
Bus lanes.
Loading controls.
Parking restrictions.
Limited working space.
Low-emission or access-controlled zones.
Complex one-way systems.
A recovery vehicle may be physically close to the incident but unable to approach it directly.
Motorways and Strategic Roads
Motorway incidents may receive higher operational priority because of the risks associated with fast-moving traffic.
Access can still depend on:
The vehicle’s precise location.
Hard-shoulder availability.
Lane closures.
Traffic-management arrangements.
Police or traffic-officer attendance.
Queue length.
Safe access to the stranded vehicle.
Smart motorway sections and stretches without a continuous hard shoulder can create additional operational complexity.
Rural Locations
Rural incidents may involve lower traffic levels but longer travel distances.
Additional challenges can include:
Limited mobile-phone coverage.
Poor lighting.
Narrow roads.
Inaccurate location descriptions.
Fewer nearby recovery resources.
Restricted access for larger vehicles.
Longer transport distances after collection.
A quieter road does not necessarily mean a faster response.
Why Waiting at the Roadside Feels Longer
For many motorists, a breakdown is more than a mechanical failure.
It can create uncertainty, disruption and concern for personal safety.
Common frustrations include:
Uncertainty about when assistance will arrive.
Limited information while waiting.
Passing traffic close to the vehicle.
Exposure to poor weather.
Travelling with children or vulnerable passengers.
Missing work, appointments or connections.
Uncertainty about whether the vehicle can be repaired.
Difficulty explaining the precise location.
Concern about onward travel.
Limited access to food, water, shelter or toilet facilities.
The actual waiting period is only one part of the experience.
A lack of clear information can make a moderate delay feel considerably longer.
Accurate location details, realistic expectations and regular progress updates can reduce uncertainty, even where traffic or safety conditions prevent an immediate response.
The Wider Operational Challenge
Roadside assistance combines mechanical knowledge with transport logistics.
The response must match:
The incident.
The vehicle.
The location.
The equipment required.
The safety conditions.
The intended destination.
A conventional passenger car with a flat battery may require relatively simple equipment.
A damaged electric vehicle, immobilised van or loaded commercial vehicle may require:
Additional safety precautions.
Specialist lifting or loading equipment.
Vehicle skates.
A larger recovery vehicle.
Controlled transportation.
Further assessment before movement.
Traffic conditions affect both sides of the incident.
The stranded vehicle may be contributing to congestion, while the attending recovery vehicle must travel through the same disruption to reach it.
Recovery performance therefore depends on more than distance or estimated journey time. It depends on coordination, vehicle availability, incident information, access conditions and the suitability of the equipment dispatched.
Why It Matters
Great Britain’s road network carries substantial and diverse traffic every day.
As vehicle numbers, technology and commercial dependence on road transport continue to evolve, roadside assistance must respond to a wider range of faults across increasingly complex operating environments.
Official traffic statistics help explain the scale of that challenge.
They do not provide:
A complete national breakdown map.
A verified ranking of breakdown hotspots.
A universal national response-time benchmark.
A single breakdown-cause dataset covering all providers.
A standard recovery outcome for every vehicle category.
A credible assessment of roadside recovery requires a clear distinction between:
Traffic volume and breakdown probability.
Geographic distance and achievable response time.
Routine faults and complex recovery incidents.
General industry guidance and verified national statistics.
Vehicle availability and equipment suitability.
That distinction is essential when reporting on roadside-assistance performance and the wider resilience of Great Britain’s road network.
Sources
Department for Transport — Road Traffic Estimates in Great Britain: 2025.
National Highways — Roads We Manage.
The AA — published guidance concerning commonly reported vehicle breakdown causes.
RAC — published breakdown and commercial-vehicle guidance.
Disclaimer
This article has been prepared using publicly available information from official organisations, industry publications and other publicly accessible sources available at the time of publication.
The ROBELIUM Newsroom provides editorial summaries intended to support general awareness of developments within the transport, mobility and roadside-assistance sectors. Content does not constitute live traffic management, live operational reporting, operational forecasting, route guidance, legal advice, safety advice or other professional advice.
ROBELIUM is not affiliated with, endorsed by, or acting on behalf of any official transport authority, public body, road operator, emergency service or third-party organisation referenced in this article, unless explicitly stated.
Information, statistics, planned activity and operational conditions may change following publication. Readers should refer to the relevant official authority or original source for the latest available information where appropriate.