A vehicle breakdown is inconvenient anywhere.
But breaking down on a quiet road and coming to a stop during the evening peak in London, Manchester or Birmingham can produce very different circumstances.
There is no comprehensive public dataset showing exactly how many vehicles break down in each UK city every year. Breakdown organisations publish national figures and some regional information, while detailed city-level data is considerably stronger for congestion and journey times.
Taken together, however, those sources provide a useful picture of the urban environments in which breakdowns occur — and where traffic conditions may make a roadside incident particularly disruptive.
London: the strongest breakdown signal
Among the available breakdown data, London provides one of the clearest regional indicators.
An AA survey found that 78% of London respondents had experienced a vehicle breakdown at some point while holding a driving licence — the highest proportion among the UK regions included in the survey.
The comparable figures were 75% in Wales, the South East and South West; 74% in Scotland and the North West; and 72% in the West Midlands.
This does not mean that 78% of vehicles in London break down annually. It records drivers’ reported experience over their time holding a licence.
London’s traffic conditions provide a second part of the picture.
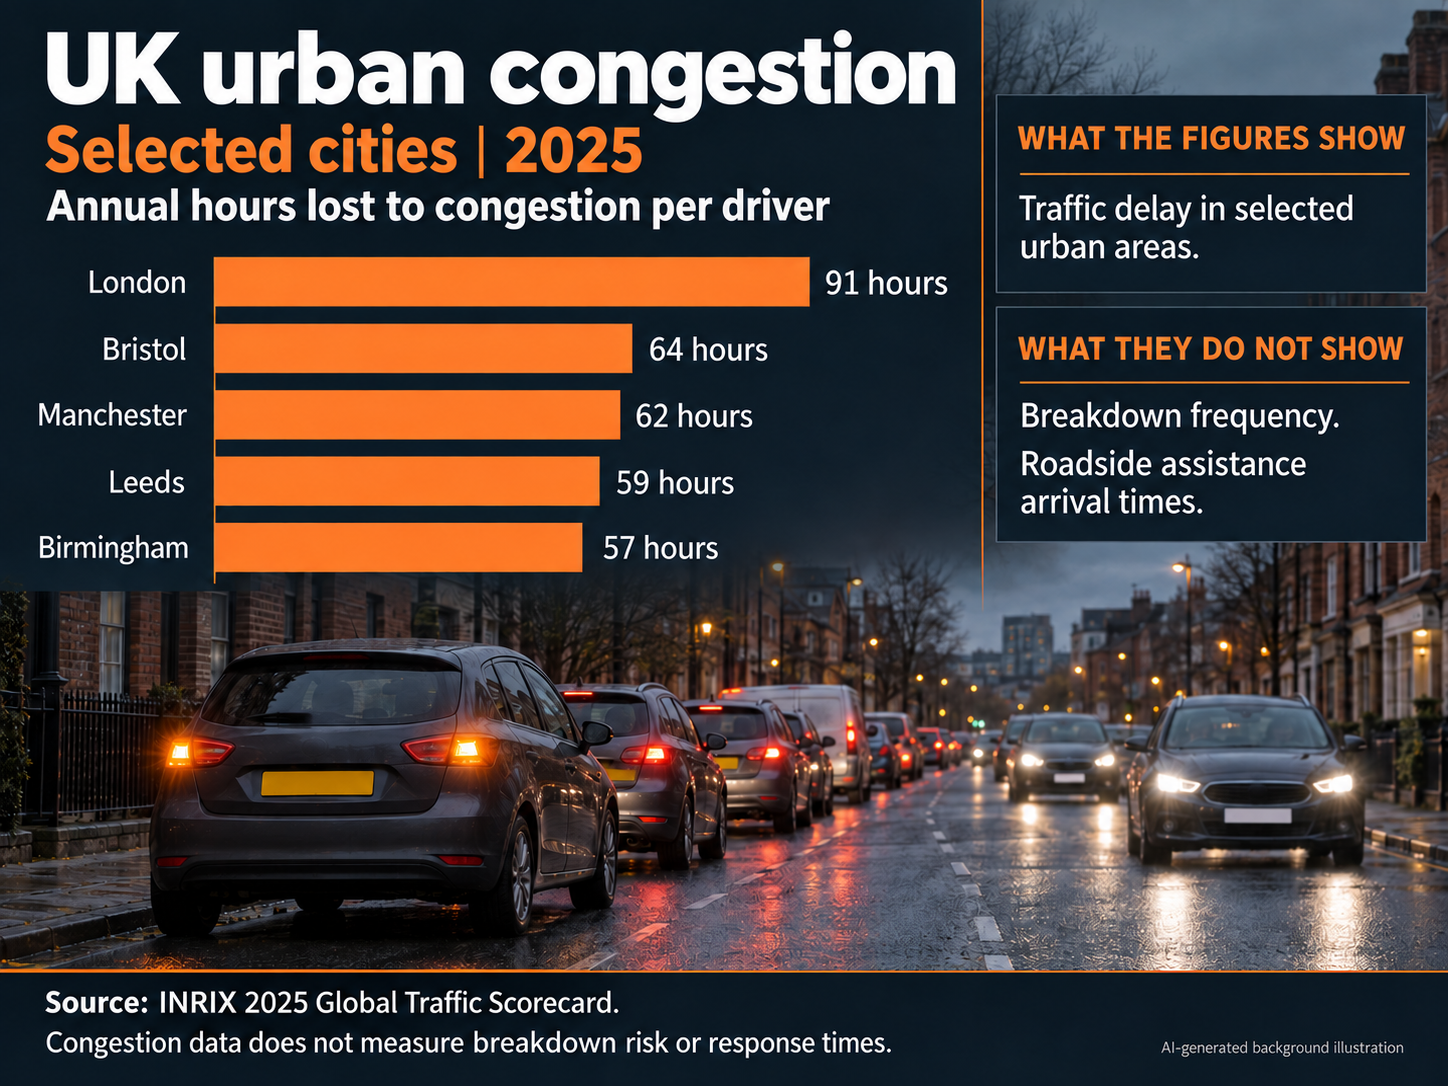
INRIX ranked London as the UK’s most congested major urban area in its 2025 Global Traffic Scorecard, with drivers losing approximately 91 hours a year to congestion.
TomTom’s separate Traffic Index also illustrates the severity of the capital’s road conditions. Its 2025 data records an average 10km journey of 36 minutes 22 seconds, increasing to 43 minutes 29 seconds during the evening rush hour.
For somebody waiting beside a disabled vehicle — and for assistance attempting to reach that location — the surrounding road network matters.
Bristol: a smaller city with substantial congestion
Bristol presents an interesting contrast.
It is considerably smaller than London, yet INRIX ranked it second among the major UK urban areas in its 2025 congestion analysis, with drivers losing approximately 64 hours during the year.
TomTom recorded an average congestion level of 51.3%.
A typical 10km Bristol journey took approximately 26 minutes 40 seconds, increasing to around 33 minutes during peak periods.
The figures demonstrate why population or geographic size alone does not necessarily indicate how difficult the traffic environment surrounding a roadside incident may be.
Manchester: evening traffic changes the picture
Manchester followed closely behind Bristol in the INRIX analysis, with drivers losing approximately 62 hours to congestion during 2025.
TomTom’s measurements show a particularly marked difference during the evening peak.
An average 10km journey took approximately 28 minutes 51 seconds.
During the evening rush hour, that increased to 38 minutes 43 seconds, with average speeds falling to approximately 15.5 km/h.
TomTom estimates that Manchester motorists lost approximately 126 hours in rush-hour traffic during 2025.
Leeds and Birmingham complete the leading five
INRIX recorded approximately 59 hours lost to congestion in Leeds during 2025, placing the city fourth among the major UK urban areas in its analysis.
Birmingham followed at approximately 57 hours.
Birmingham’s road environment is particularly notable because the urban network connects with several of Britain’s busiest strategic motorway corridors, including the M5, M6, M40 and M42.
TomTom records an average 10km Birmingham journey of approximately 21 minutes 30 seconds, increasing to 29 minutes 25 seconds during the evening rush hour.
Again, these figures measure congestion — not the number of vehicles breaking down.
Britain’s major urban congestion pressure points
The INRIX 2025 figures provide a consistent comparison of five major UK urban areas:
London — 91 hours
Bristol — 64 hours
Manchester — 62 hours
Leeds — 59 hours
Birmingham — 57 hours
Figure 1 — Annual hours lost to congestion in selected major UK urban areas, 2025
The wider UK picture
TomTom’s 2025 data identifies substantial rush-hour delays beyond those five cities.
It records approximately:
London — 141 hours lost during rush hour
Edinburgh — 127 hours
Manchester — 126 hours
Bristol — 118 hours
Liverpool — 99 hours
Sheffield — 99 hours
Birmingham — 97 hours
Glasgow — 86 hours
These figures use a different methodology from INRIX and should not be combined into a single ranking.
They do, however, demonstrate how widely difficult urban traffic conditions extend across Britain.
Millions of roadside incidents every year
While city-by-city breakdown numbers are difficult to establish, the national scale of roadside assistance is much clearer.
The AA reports attending approximately 3.5 million breakdowns annually, while published comparative information puts RAC attendance at approximately 2.4 million.
The AA also reports having around 2,700 patrols operating on UK roads.
Breakdowns themselves are changing as vehicles become increasingly dependent on electronics.
In 2026, the AA reported that breakdowns associated with Body Control Modules — electronic systems controlling functions such as lighting, windows, locking, alarms and wipers — had doubled since 2020 to more than 36,000 annually.
Road condition remains another contributor.
RAC patrols attended 26,048 pothole-related breakdowns during 2025, involving problems including damaged shock absorbers, broken suspension springs and distorted wheels. That represented a reported 15% increase compared with 2024.
How long are motorists waiting?
Response time is one of the most important questions following a breakdown — but it is also one of the most difficult areas to compare accurately.
There is currently no reliable public city-by-city dataset showing average roadside-assistance arrival times for London, Bristol, Manchester, Birmingham and other major UK cities.
Current comparative information published by Green Flag states that both Green Flag and the AA have average response times of under one hour. Its equivalent comparison with RAC also lists an average response time below one hour for both providers.
Independent consumer research from Which? provides another perspective. Its 2026 breakdown-cover analysis surveyed more than 8,000 people who had experienced a breakdown during the previous 12 months, examining customer satisfaction, waiting times and call-out outcomes.
An advertised national average should not be interpreted as a guaranteed arrival time.
Traffic conditions, weather, location, vehicle type, incident severity, patrol availability and overall demand can all influence an individual breakdown response.
Are customers satisfied?
Independent research also provides an indication of how customers view the major breakdown providers.
Research conducted by Censuswide for Finder in February 2026 asked breakdown-cover customers whether they would recommend their provider.
The reported recommendation rates were:
AA — 92%
Green Flag — 91%
RAC — 88%
Start Rescue — 88%
A separate measure, the UK Customer Satisfaction Index for July 2026, recorded scores of:
AA — 79.5/100
Green Flag — 78.1/100
RAC — 75.8/100
The two studies use different methodologies and should not be combined into a single performance ranking.
They nevertheless provide useful context alongside the traffic and breakdown data.
When location becomes part of the breakdown
The available evidence points towards a distinction that is easily overlooked.
A breakdown begins as a mechanical, electrical or vehicle-related event.
What happens afterwards is also influenced by where and when that event occurs.
London combines the strongest regional breakdown-experience figure identified in the available AA survey with Britain's most severe major-city congestion.
Bristol demonstrates that a smaller city can experience substantial traffic pressure.
Manchester shows how sharply conditions can change during the evening peak.
Birmingham combines a major urban road network with some of the country’s most important motorway connections.
And Edinburgh, Liverpool, Sheffield and Glasgow demonstrate that difficult urban traffic conditions are by no means confined to England’s largest cities.
The mechanical problem may be the same.
The circumstances surrounding it can be very different.
Information note
There is currently no comprehensive publicly available dataset providing directly comparable annual breakdown-callout volumes and roadside-assistance response times for every UK city.
For that reason, this article does not present congestion statistics as breakdown-frequency statistics.
City comparisons use published traffic information to describe the road environment in which breakdowns and roadside assistance occur. Breakdown statistics are identified separately where provider information is available.
INRIX and TomTom also use different methodologies. Their figures should therefore be considered separately rather than combined into a single ranking.
Sources
Public information referenced in this article includes the AA, RAC, Green Flag, INRIX 2025 Global Traffic Scorecard, TomTom Traffic Index, Which? consumer research and Finder/Censuswide customer research.
Disclaimer
ROBELIUM Newsroom provides editorial information compiled from publicly available transport, roadside-assistance and independent consumer-research sources. It is intended for general awareness and does not constitute live traffic information, roadside-assistance advice, service-performance forecasting or a guarantee of response times.